Difference in two means using z-statistic : according to the central limit theorem, the difference in two sample means is normally distributed for large sample sizes. The z formula for difference in two sample means for large and independent samples is given by
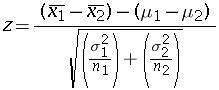
if the populations are normally distributed and if population variances are not known then the samples variances can be used if sample size is large.
Hypothesis testing can be used in practical scenarios to find out if the mean of a sample differs from the mean of another sample. This would be a two tailed test.
The confidence interval for the difference in the mean is given by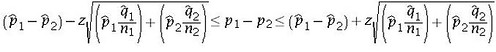
This confidence interval gives a (1-aplha)% confidence level.
Difference in two means – t formula
This methodology can by used if the sample size is small, the samples are independent and the population variance is not known but is assumed to be equal. However, the measurement being studied should be normally distributed.
The t value is given by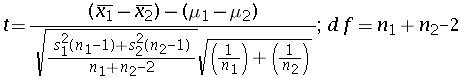
For cases where the population variances of the two population are not equal the unpooled formula can be used.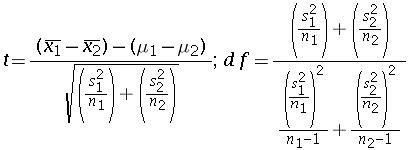
The confidence interval for the difference between the mean of two population for small independent samples and when population variances are unknown is
Inferences for related population : Sometimes sample are taken from two populations that are related. For example, samples taken for calculating illiteracy level before a literacy program is implemented and after it is implemented. Here the population remains essentially same however the measurement that is being taken has changed.
This test is called a matched pair test or t-test for related measures or correlated t test. The t-formula is given by
where df=n-1, n = number of pairs, d = sample difference in pairs, D = mean population difference Sd =SD of sample difference and d(bar) = mean sample difference.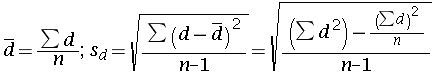
The confidence interval is given by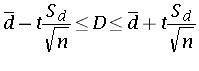
Comparison of proportions for two populations:
E.g. comparing the market share of a product for two different markets. The formula is given by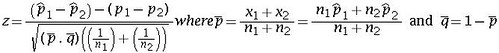
The confidence interval for the difference is given by
Two population variances:
The ratio of sample of two variances is called the F value and is the ratio of square of sample variance of sample1 to square of sample variance of sample 2. A distribution for various values of s1 and s2 is called an F distribution. This distribution has degrees of freedom for the numerator and the denominator. Note that the two populations should be normally distributed.